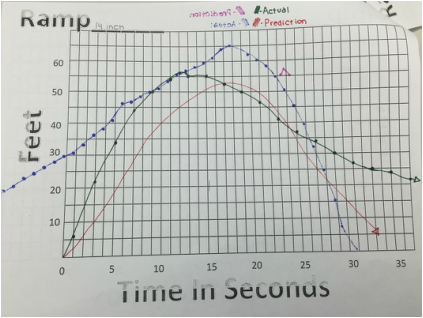
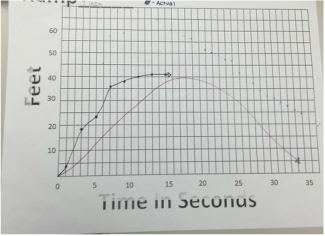
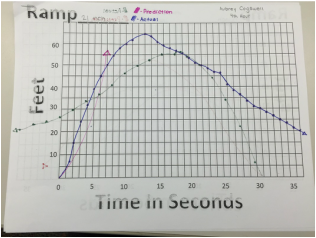
  | My prediction was relatively close to the actual graph, but it was only a prediction. I didn't make the graph decrease as the skateboard came to a stop, and then started moving backwards. My initial reasoning that led to the way my graph turned out was because I thought the skateboard was only going to go up in feet and then come to a stop. The zeros represent where the skateboard started at zero feet and zero time before it was released on the ramp. All three ramps have zeros at the origin, and they also all have maximums and minimums however they are at different locations. As the ramp got smaller, the graphs got wider. When the graph is rising the fastest is when the skateboard was first released, and has a lot of acceleration, the graph is falling the fastest when the skateboard comes to a stop and then reverses in feet. It starts having momentum, but then slows and comes to a complete stop. |
 RSS Feed
